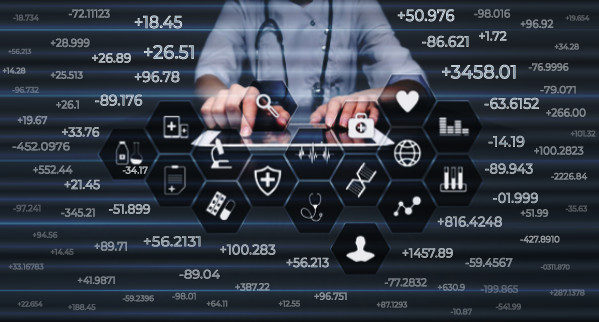
The field of healthcare is undergoing a revolution with the increasing adoption of technology – devices, sensors, software, insights and artificial intelligence. Unfortunately buzzwords such as machine learning and Big Data have clouded this conversation. People throwing around these buzzwords do a major disservice to any real adoption of new technologies. And I am not the only one who is bothered by this: others are voicing their concerns too: Machine Learning – Can We Please Just Agree What This Means? Although machine learning and big data have become buzzwords, which these days do carry a negative connotation, in this particular case it is making significant inroads in healthcare. What is Big Data, what is machine learning and how are they changing healthcare?
Defining Big Data is like defining what life is – it depends on who you ask. The simplest and closest definition is attributed to Gartner – Big data is high-volume, high-velocity and/or high-variety information assets that demand cost-effective, innovative forms of information processing that enable enhanced insight, decision making, and process automation. But not everybody agrees, according to The Big Data Conundrum: How to Define It, published by MIT Technology Review, Jonathan Stuart Ward and Adam Barker at the University of St Andrews in Scotland surveyed what it means to different organizations and got very different results and bravely finished their survey with a definition of their own: Big data is a term describing the storage and analysis of large and or complex data sets using a series of techniques including, but not limited to: NoSQL, MapReduce and machine learning. One significant evolution of the term seems to be the marriage of the concept with the enabling technology or algorithmic framework, specifically database, optimizing algorithms and machine learning.
So let’s now turn our focus on machine learning, which has similar problems. To me machine learning is simply the process by which a computer can learn to do something. That something might be as simple as reading the alphabet, or as complex as driving a car on its own. Although explaining this to a non-technical audience is not easy, valiant efforts have been made by some lost souls, for example, Pararth Shah, Ex-Stanford student and currently at Google Research, How do you explain Machine Learning and Data Mining to a layman? and Daniel Tunkelang, data scientist, who led teams at LinkedIn and Google, How do you explain machine learning to a child?” How this learning can take place, however, is harder to explain. Before attempting that, let me clarify some other relevant technical jargons people may have thrown at you, such has AI, soft computing and computational intelligence. AI, which stands for Artificial intelligence, is the generic study of how human intelligence can be incorporated into computers. Machine learning, which is a sub-area of AI, on the other hand, concentrates on the theoretical foundations used by computational aspects of these algorithms, considered to belong to the field of Computational Intelligence and Soft Computing, some examples of which are neural networks, fuzzy systems and evolutionary algorithms. More simplistically, a machine-learning algorithm is used to determine the relationship between a system’s inputs and outputs using a learning data set that is representative of all the behavior found in the system using various data modeling techniques. This learning can be either supervised or unsupervised.
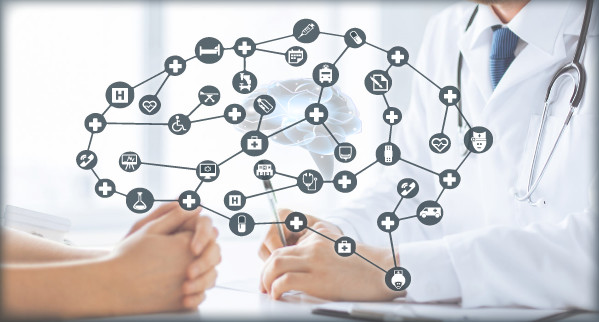
The interesting reality is that whether we are aware or not, machine learning based solutions are already part of our daily lives, so much so that BBC thought it would be fun just to point it out in Eight ways intelligent machines are already in your life. Not surprisingly, one of the eight areas mentioned there is healthcare.
Now we come to the hard part of this discussion. There are numerous different interplays between big data, machine learning and healthcare. Thousands of books are being written on it – my most recent search on Amazon with “machine learning” yielded 14,389 matches! Dedicated conferences on this topic are being organized. There are so many courses on it that David Venturi from Udacity was inspired to research and publish Every single Machine Learning course on the internet, ranked by your reviews. Virtually almost all healthcare startups are now expected to use some form of machine learning – VC funding to healthcare startups that uses some form of AI increased 29% year-over-year to hit 88 deals in 2016, and are already on track to reach a 6-year-high in 2017. A good starting point, however, is “Top 4 Machine Learning Use Cases for Healthcare Providers” written by Jennifer Bresnick. She broadly identifies the following areas where significant inroads have already been made by machine learning, imaging analytics and pathology, natural language processing and free-text data, clinical decision support and predictive analytics and finally, cyber-security and ransomware. If you are looking to get more specific, check out 7 Applications of Machine Learning in Pharma and Medicine by Daniel Faggella, where he identifies applications that use machine learning with the most forecasted impact on healthcare – disease identification/diagnosis, personalized treatment/behavioral modification, drug discovery/manufacturing, clinical trial research, radiology and radiotherapy, smart electronic health records and finally, epidemic outbreak prediction. In reality, it is becoming harder and harder to find any area of healthcare which is untouched by machine learning in some way these days.
Why is this happening? It’s because we are realizing that machine learning has enormous potential to make healthcare more efficient, smarter and cost effective. My prediction is that in the future, we will not talk about machine learning as a separate tool, it will become so ubiquitous that we will automatically assume it is part of a solution, much in the same way we do not think of internet search as a separate tool anymore, we automatically assume it is available. The more important question is now that the jinni is out of the bottle, where will it end? Will we one day have completely autonomous artificial systems such as the famous Emergency Medical Hologram Mark I replace human doctors as the creators of Star Trek imagined? Or will healthcare prove to be so complex that no machine can ever replace humans completely? Only time will tell.